
Maximally Selected Rank Statistics Method (MSRSM) in R - Applied in Hematology
R programming in Medical Research

When to Use
To separate two groups with a simple cut-point (or cut-off value) of a continuous variable, so as to produce the most distinct difference in survival analysis.
Application of Maximally Selected Rank Statistics in Hematology
To determined cut-off value of mean gene expression (MGE) to discriminate overall survival in two types of diffuse large B-cell lymphoma (DLBCL). by Ash A. Alizadeh et. al (2000) Nature.
To determined cut-off value of measurable residual disease (MRD) to discriminate duration of response (DOR) and survival with acute myeloid leukemia (AML). by Buccisano et. al (2006) Leukemia.
To determined cut-off value of metabolic tumor volume (MTV) and maximum standardized uptake value (SUVmax) measured at baseline and at 1-month , to discriminate progression free survival (PFS) in large B-cell lymphoma (DLBCL) receiving CAR T-cell infusion. by Iacoboni et. al. (2020) Blood.
To determined cut-off value of the prognostic nutritional index (PNI) in patients with newly diagnosed, CD5-positive diffuse large B-cell lymphoma. by Ma et. al. (2022) Cancer.
How to Use
Detailed instructions were on CRAN Package ‘
maxstat’ (link).
library(maxstat)
library(survival)

cutoff <- maxstat.test(Surv(time, cens) ~ MGE, data=DLBCL, smethod="LogRank", pmethod="HL")
print(cutoff)
plot(cutoff, cex=2, lwd=2.5)
time as time until event
cens as status indicator of censored event (e.g., death, progression)
MGE as targeted continuous predictor, a numeric vector
DLBCL as dataset
smethod allows the selection of statistics to be…
"LogRank" = compares estimates of the hazard functions of the two groups at each observed event time.
Others : "Wilcoxon", "Median", "NormalQuantil","LogRank", "Data"
pmethod defines which kind of P value approximation is computed
"HL" = the upper bound of the P-value by Hothorn and Lausen (2003).
"exactGauss" = the distribution of a maximally selected Gauß statistic.
"Lau92" = limiting distribution.
"Lau94" = based on the improved Bonferroni inequality.
"condMC" = via conditional Monte-Carlo.
"min" = calculate P value by all approximation methods and choose the lowest p as a result.
"none" = no P value produced.
The results will seem like this:
Maximally selected LogRank statistics using HL
data: Surv(time, cens) by MGE
M = 3.171, p-value = 0.02218
sample estimates:
estimated cutpoint
0.1860526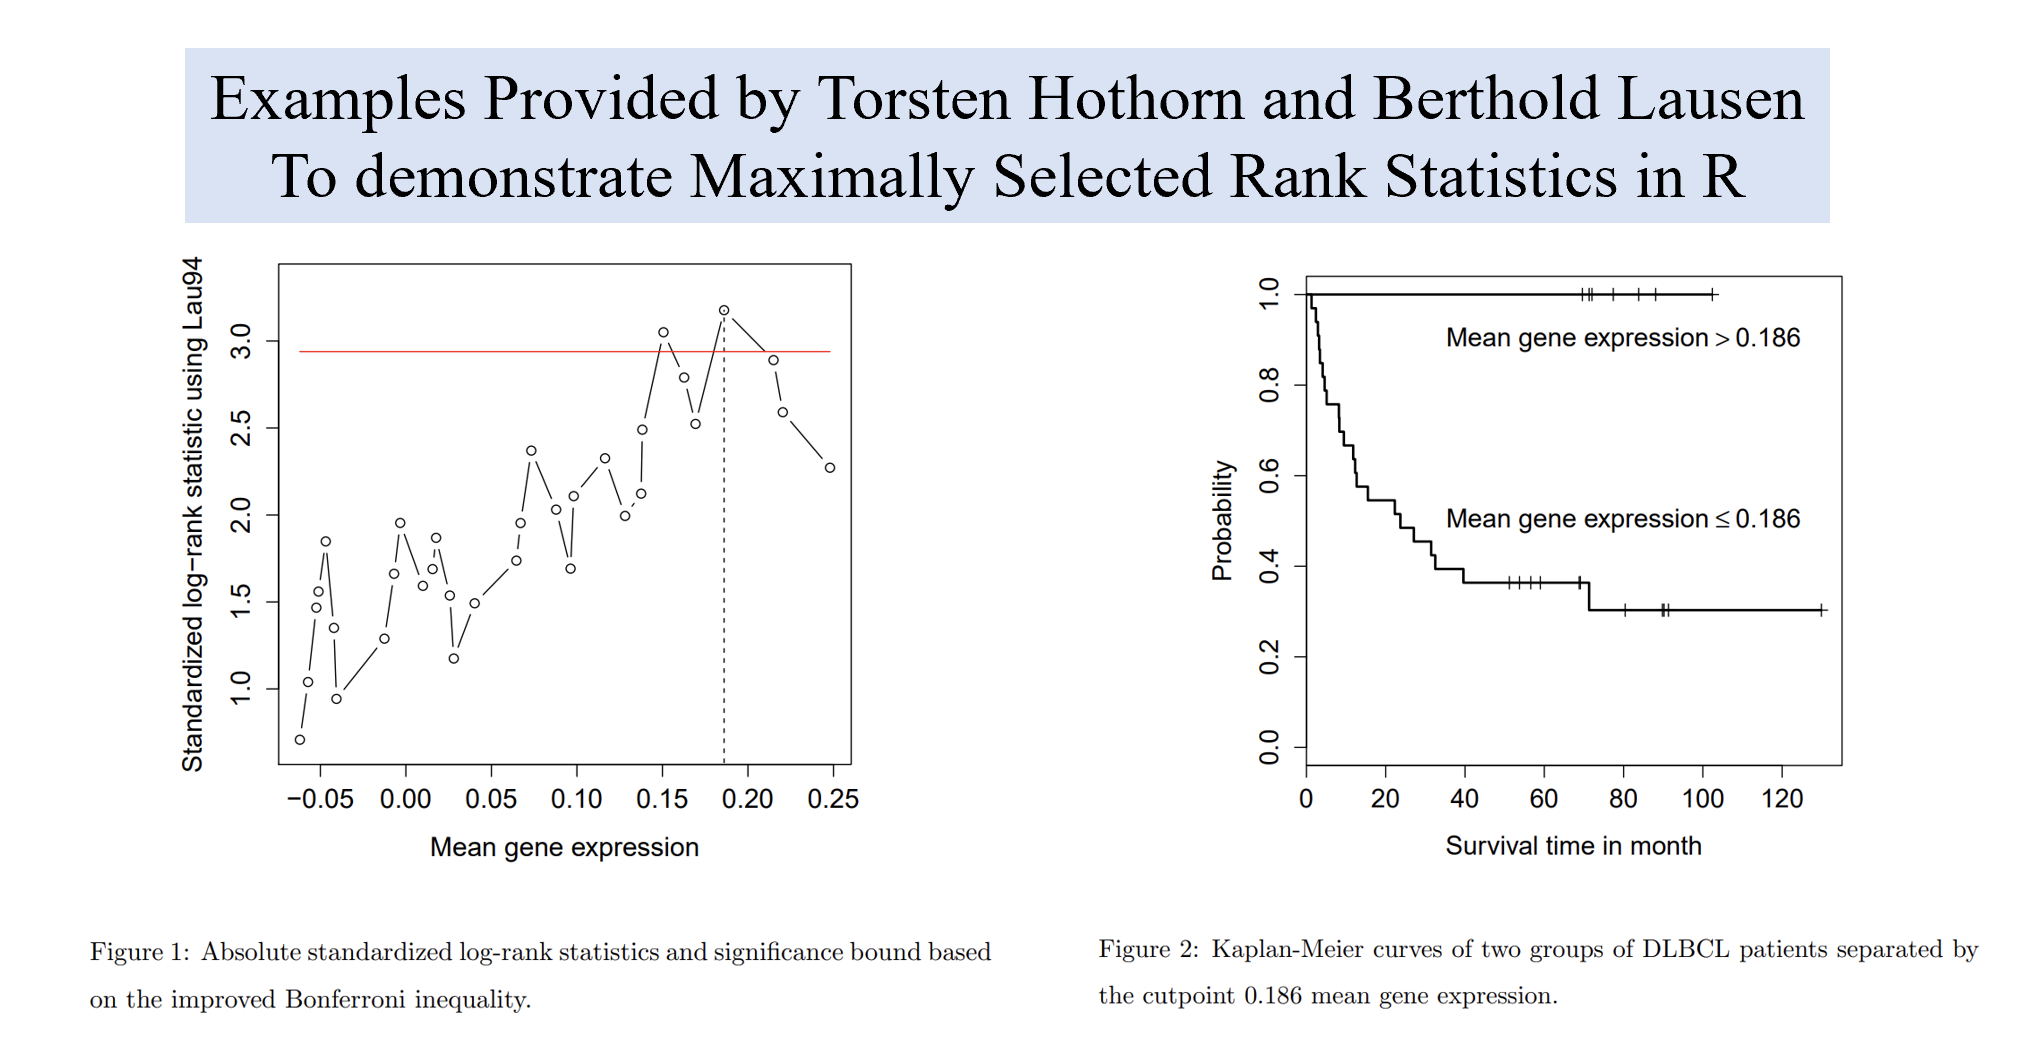
Caveats
The asymptotic argument holds also in the case of tied or censored observations. That is, it would still produce a cut-off value in groups of non-significant differences.
There’s no need to transform the time-dependent end point.
The first group with X-values (predictor) less or equal µ (cut-off) and the second group with X-values greater µ.
To assess an optimal selected prognostic factor from a set of prognostic factors of interest (e.g., to determine whether IPI or MGE impact OS of DLBCL more), may use following code:
mmax <- maxstat.test(Surv(time, cens) ~ MGE + IPI, data=DLBCL, smethod="LogRank", pmethod="exactGauss", abseps=0.01)
print(mmax)
Maximally selected LogRank statistics using exactGauss
data: Surv(time, cens) by IPI
M = 2.9603, p-value = 0.01141
sample estimates:
estimated cutpoint
1
Adjusted p.value:
0.03417403 , error: 0.0009709537We may compare p values of different predictors produced by MSRSM to determine which can better predict prognosis.
References
Hothorn, T., & Lausen, B. (2002). Maximally selected rank statistics in R. R News, 2(1), 3-5.
Lausen, B., & Schumacher, M. (1992). Maximally selected rank statistics. Biometrics, 73-85.
Delgado, J., Pereira, A., Villamor, N., López-Guillermo, A., & Rozman, C. (2014). Survival analysis in hematologic malignancies: recommendations for clinicians. haematologica, 99(9), 1410.
Lausen, B., Hothorn, T., Bretz, F., & Schumacher, M. (2004). Assessment of optimal selected prognostic factors. Biometrical Journal: Journal of Mathematical Methods in Biosciences, 46(3), 364-374.